Qualitative research data collection with close-ended survey questions…

I’m working on a manuscript on the topic of selecting the correct research method and design to answer research questions, and I wanted to share an example of a study that went sideways. Ambrose (2022) posited five research questions that focused on the relationship between nine variables. To graphically depict the research questions, see this figure:

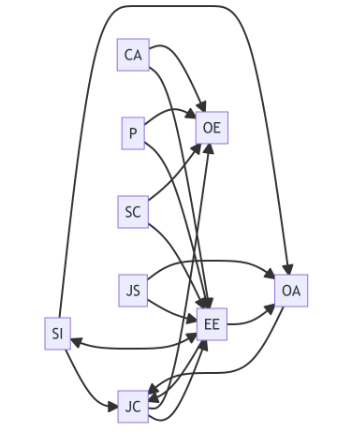
It looks convoluted to me! What’s more convoluted is that the emerging scholar chose a qualitative research method to answer these relationship questions. How much time would a researcher have to spend to understand these relationships? Perhaps one or two in a study, but nine?

Not only that, but the author created a survey instrument with combined closed- and open-ended questions. After obtaining a sample of 197 (anonymously), the emerging scholar reported descriptive statistics on the closed-ended ‘questions’ by group (contract, part-time, full-time) and opined on the differences. No statistical tests; just observations.

I’m surprised the faculty advising this student didn’t know better. I converted the responses to follow a quantitative research design, performed a series of Chi-square tests, and found something significant. I guess what I’ve done is not provide evidence for the emerging scholar’s study; I just found evidence that human observation can be incorrect.

Reference:

Ambrose, M. K. T. (2022). Examining organizational embeddedness of full-time, part-time, and contract workers within the values of job satisfaction, pay, supervisory relationships, and promotion [Doctoral dissertation]. ProQuest Dissertations & Theses Global: The Humanities and Social Sciences Collection (299956545)

“Most of the respondents gave a good rating for both brands…”

Within an hour after making my prior post, another student cited an article from the Journal of Emerging Technologies and Innovative Research. I suspect US-based students are citing this journal because of it’s reported Impact Factor of 7.95, which is showing up in their searches.

The article cited was from Agrawal and Kumar (2023). In this article, the authors explored what they describe as Fast Moving Consumer Goods (FMCG), such as food and beverage, personal care, and healthcare goods. They focused on products sold by two companies: Hindustan Unilever Limited (HUL) and ITC. The authors compared five brands in the soap, cream, coffee, deodorant, and dishwashing soap categories.

There is quite a bit of descriptive statistics reported about their sample (N = 100); however, critical data can be found in Tables 11 and 13. In Table 11, the authors report the respondents views towards the products based on their quality as measured on a 5-point Likert scale. Similarly, in Table 13, they measure respondents brand ratings based on cost (also measured on a 5-point Likert scale).

What’s interesting about this research is that there is simply no data analysis other than descriptive. However, there are two pages of results and findings. Nearly all of the “findings” are simply restated descriptive statistics. Why not numericize the 5-point Likert scales, show the M/SD, and compare groups? Or, perform a Chi-square test of differences in responses?

I did the latter for brand rating based on quality. Only one group difference was found: VIM and Neameasy Gel in the dishwashing soap category. X2(4)=16.481, p =.002, w = 2.03, 95% CI (0.75, 2.85). The size of the effect is large, which means there is a large difference in the view of quality, with VIM being viewed as higher. Now, there is something to write about. I don’t know this product, but perhaps that could be the focus of a “finding.” I did the same type of test for the brand rating based on cost. There were no differences.

My question is: Why drone on about two company’s products when they are viewed as the same in both brand quality and cost (or value); with the lone exception being the dishwashing soap?

Bhardwaj, Agarwal, & Chuauan (2023)…

An undergraduate marketing student cited this study in an assignment relating to brand awareness. The Journal of Emerging Technologies and Innovated Research reports itself as an open access, peer-reviewed, refereed journal and charges authors $55 USD to publish. Honestly, that’s a lot cheaper than some.

I reviewed the study and couldn’t believe the poor quality of the research and data analysis. Just a few points that popped out at me:

  • The purpose of the study was to “examine the connection between consumer brand recognition, brand satisfaction, brand commitment, and brand loyalty” (emphasis added). However, upon further exploration, the authors only measured two dimensions: brand awareness and repeat purchases.
  • The authors report that they used a questionnaire, but they don’t include it nor do they refer to any instrument used to measure the dimensions
  • They perform a chi-square test, which is a test normally used to assess differences in group proportions. Later, the authors reported a simple linear regression formula, which makes no sense. To perform linear regression, the dependent variable would need to be measured using an interval or ratio method. To confuse things even more, in the conclusions and suggestions section, the authors report they performed ordinal regression.
  • In the paper’s conclusions and suggestions, the authors report they find evidence of mediating factors (e.g., brand trust, brand belief, brand advocacy). Mediating factors between what and what?

Taking into account potential English-language conversion issues (this is an Indian journal), this is still just an extremely poor study. I’ve already sent a letter to the editor to have this article retracted for the reasons mentioned in this blog. This will be a great teaching item for all my marketing, research methods, and statistics students this term.

An evaluation of Slogar et al. (2023)…

Earlier this week, I had a US-based student in a graduate-level marketing cource discuss Slogar et al. (2023) in an assignment regarding entrepreneurial marketing. I read the article and pointed out to the student the article is not necessarily related to marketing but entrepreneurial orientation and its influence on firm performance. Orientation, according to the authors, has three components:

  • Innovativeness
  • Proactivness
  • Risk-taking

However, I started looking at the article and its sources. Two sources popped out to me: Miller and Friesen (1981) and Covin and Sleven (1991). I read these articles in graduate school, so I decided to skim Slogar et al. to see how these researchers evaluated the sources and executed their research.

The first item I found of interest was Slogar et al.’s use of Country and Industry Effects as interval control variables. Country was defined on a 1-6 scale with each country being assigned to a number. Industry Effects was set on a 1-8 scale with specific industries being assigned a number (with 8 representing “Other”). See the authors descriptive statistics (e.g., M, SD) relating to these categorical variables on p. 8 of their study. What wasn’t discussed by Slogar et al. were that a variable called Firm, which is defined as “the number of total employees within the firm” (p. 7), was treated as an ordinal variable (M = 1.7, SD = 0.73). Treating these categorical variables and ordinal variable as interval, rather than using dummy coding (or other categorical coding methods), makes the control variables invalid and the rest of their model incorrect.

Another concern I have is how Slogar et al. surveyed “organizations” using the Covin and Slevin instrument, which was originally directed to firm owners. How can organizations take a survey? Slogar et al. describe sending out surveys to 9,000 firms in southeast Europe and only receiving 963 usable responses; however, there is no statement whether there were controls in place to eliminate surveys completed by more than one person at a company.

There are a few more items I have concerns about but I would need to the data to confirm. I’ve requested a copy of the data from the authors, and have drafted a Letter to Editor.

Note: The journal where this article was published, Administrative Sciences, is an Open Access Journal. According to their webpage, the journal (currently) charges USD$2,200 per article to be published. What’s the chance they would retract an article after accepting payment?

References:

Clovin, J. C., & Slevin, D. P. (1991). A conceptual model of entrepreneurship as firm behavior. Entrepreneurship Theory and Management Journal,16(1) 7-26. https://doi.org/10.1177/104225879101600102

Miller, D., & Friesen, P. H. (1982). Innovation in conservation and entrepreneural firms: Two models of strategic momentum. Strategic Management Journal, 3(1), 1-25. https://doi.org/10.1002/smj.4250030102

Slogar, H., Milovanich, B. M., & Hrvatin, S. (2023). Does the relationship between entrepreneurial orientation and subjective financial firm performance have an inverted U-shape? Evidence from Southeast European SMEs. Administrative Scienses, 13(2), Article 26. https://doi.org/10.3390/admsci13020026

Repost…

My oldest son asked me once why I blog about the quality of mentor-reviewed, student-completed research. I explained to him that the quality of research being published, social science or not, has been shown to fraught with errors.

I want to quote from Dr. Gelman’s last paragraph –

Research is not being done for the benefit of author or the journal; it’s for the benefit of the readers of the journal, and ultimately for society. If you don’t want your work to be publicly discussed, you shouldn’t publish it. We make criticisms in public for the same reason that we write articles for publication, because we think this work is ultimately of relevance to people on the outside

Andrew Gelman